The Analytics feature is designed to provide you with actionable insights, helping you make informed decisions based on real-time data. With Analytics, you can easily track, measure, and understand key metrics that matter most to your business.
Whether you're looking to analyze user engagement, monitor performance trends, or identify growth opportunities, Analytics equips you with the tools you need to visualize and interpret data effectively.
Filters

The Filter feature in Analytics allows you to customize your data view to focus on specific time frames and campaigns. By default, Analytics displays data from the last month. However, you can adjust this to see data for the last week, last 14 days, or a specific date range that suits your needs. Additionally, you can filter by campaign to view data from a particular campaign or select all campaigns to get a complete overview.
Note: Currently, only LinkedIn Metrics are available. Email metrics and Reports snapshot are coming soon!

Invites health score: it helps you track if your invite activity aligns with LinkedIn's limits. A "good" or "excellent" score indicates that you're within safe limits, while a "bad" score warns that you may be approaching or exceeding LinkedIn's thresholds. Monitoring this metric regularly helps you avoid restrictions by adjusting your invite rate to stay within recommended levels, keeping your account safe from potential risks.
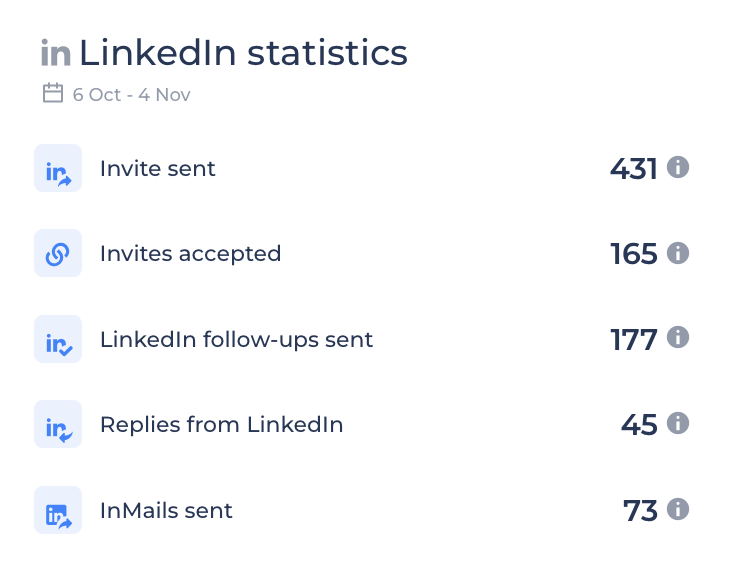
Invites sent: this metric shows you the total number of Invites that you have sent from DotSimple since you started your campaign automations. You will also be able to compare the amount of invites sent in the past two weeks, and the two weeks prior to that.
Invites sent accepted: it shows the total number of accepted invites within your selected date range. It also breaks down the amount of these accepted invites by whether they included a connection message or not. This helps you understand the impact of personalized messages on your connection success rate.
Connection rate: this metric displays the percentage of your total invites that were accepted within the selected date range. It also breaks down the acceptance rate further, showing the percentage of invites accepted with a connection message versus without one. Additionally, this metric provides a comparison of your connection rate over the last two weeks against the prior two weeks.

LinkedIn follow-ups sent: this metric shows you the total number of follow-ups that you have sent from DotSimple since you started your campaign automations. You will also be able to compare the amount of invites sent in the past two weeks, and the two weeks prior to that.
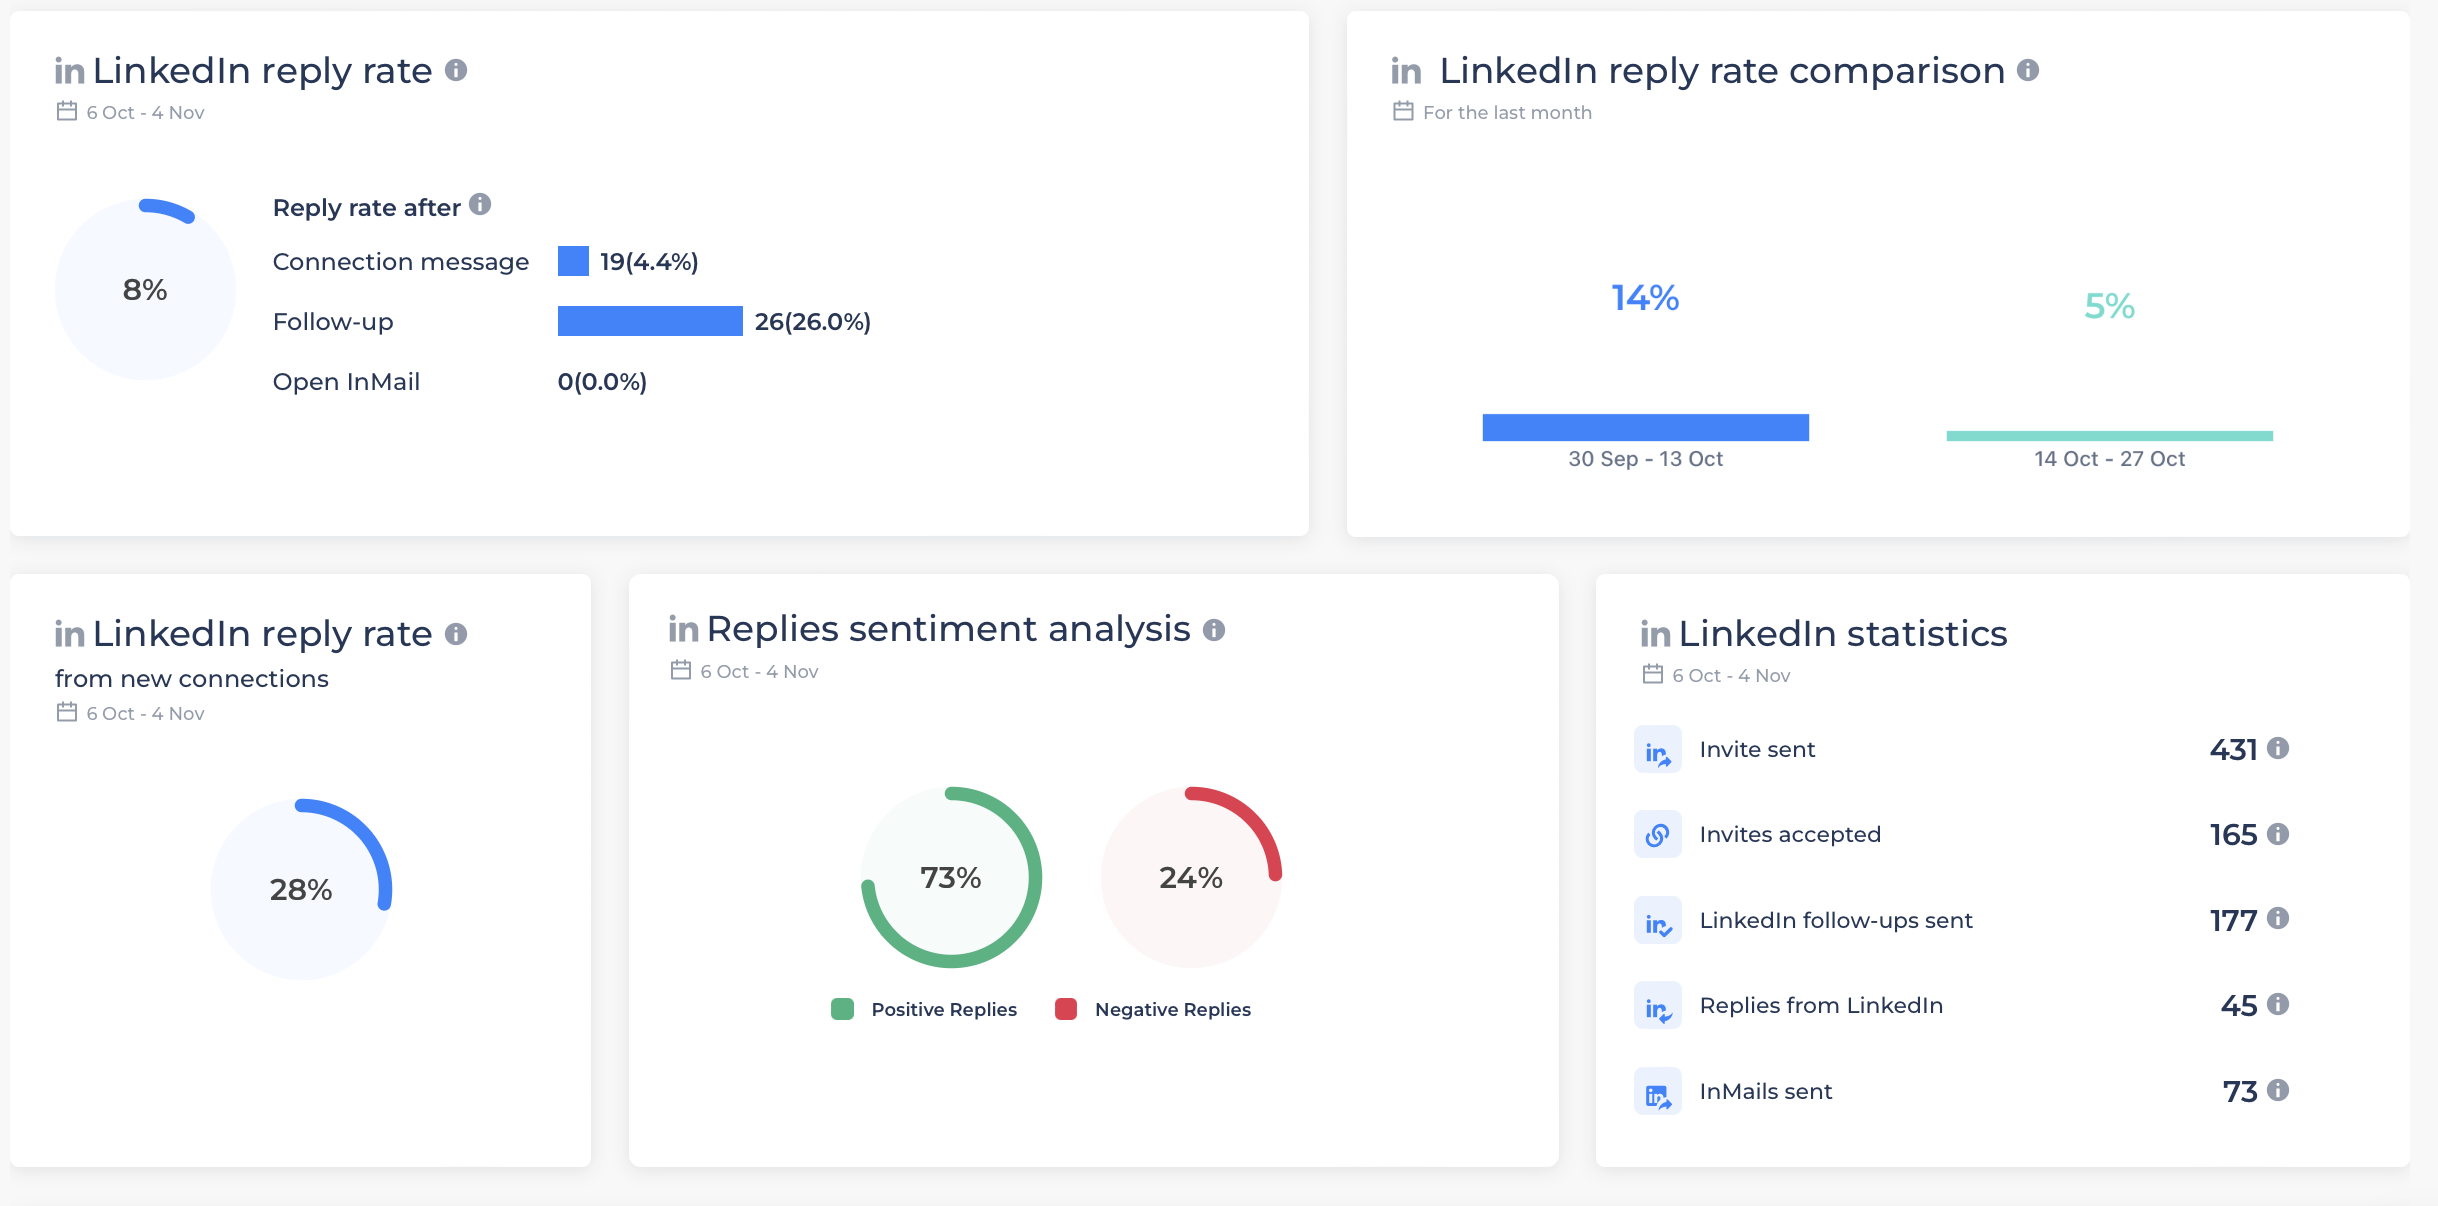
Follow-up reply received after: This metric tracks the engagement of your follow-up messages by showing the total number and percentage of replies received from campaign members after the 1st, 2nd, and 3rd follow-ups.
Note: replies received after the 4th follow-up or later are not included.

LinkedIn reply rate: this metric shows you the total number and percentage of replies received to your connection messages, follow-ups and Open InMails from the date range selected.
Note: the percentage shown in the circle represents the total percentage of replies received from all your campaigns or the campaign selected.
LinkedIn reply rate comparison: this is a static metric and it will not change according to your selected date range. It will display the comparison of replies received between the last 2 weeks and the 2 weeks prior.
LinkedIn reply rate (from new connections): it shows the total percentage of the replies received only from your New Connections campaigns.
Replies sentiment analysis: it provides the rate of positive and negative responses from campaign members. This metric is powered by AI, which interprets the sentiment of each reply to categorize it as positive or negative. However, please note that this process may occasionally report inaccurate results, as AI sentiment recognition is not always perfect.

In this section you will be able to see the overall statistics for your campaigns, this metric is sensitive to the date range you select in your filters.

The sequence funnel will give you a clear view of your campaigns's progress, starting from the total number of campaign members, invites sent, invites accepted, replies from LinkedIn and Leads generated*.
* Leads generated: In order to account leads generated, you will need to to use the default tag "Lead" in the in-app inbox.
If you need some time to get used to Analytics, don't worry! You will be able to switch to the old dashboard at the top of the page:

All sections and metrics in Analytics have their own tooltip that will help you understand how these values are calculated. However, if you have any questions, please do not hesitate to reach out to us through the support chat or at support@dotsimple.io.